Showing posts with label Going Global. Show all posts

Sunday, October 2, 2016

Google Expeditions - The WOW Factor!


Yesterday, I was lucky enough to attend EdCampSD in Escondido and learn from Jen Roberts as she shared Google Expeditions. I had read about Expeditions, which was released shortly after my Google GEO Teacher Institute in June 2015, but hadn't tried it myself.


- I had actually participated in a web meeting with an Expeditions team member this past spring with two of my kids. He interviewed them about what they were interested in exploring in Antarctica. It was pretty cool to have a connection to Expeditions and I've been really excited to get started.

So Jen pulled out a few Google Cardboard boxes and had us all download the Expeditions app to our phones or ipads. Out of about 30+ people in the room, we had about 8 viewers so most of us just used our devices without the viewer.

First take away - We don't need to use cardbooard or a VR viewer to do an Expedition! It works just fine full screen on our phones or tablets. The device just needs to have a gyro.

Next, she had me set up as a leader on my ipad. It's as simple as clicking LEAD on the app. I searched for an Expedition - chose an Underwater Excursion, downloaded it - and off we went. Others in the room opened the app, found my name and clicked JOIN.

Teacher View - Starting Expedition
Student View - JOIN Teacher's Expedition


Seeing the teacher and student view at the same time was exactly what I needed to understand how this works and be ready to share with my class and my team mates. I can't wait! We are going on some Expeditions! Next stop - Mt. Everest! or Yosemite! or the Googleplex! or Stanford! or Antarctica! So many choices!!

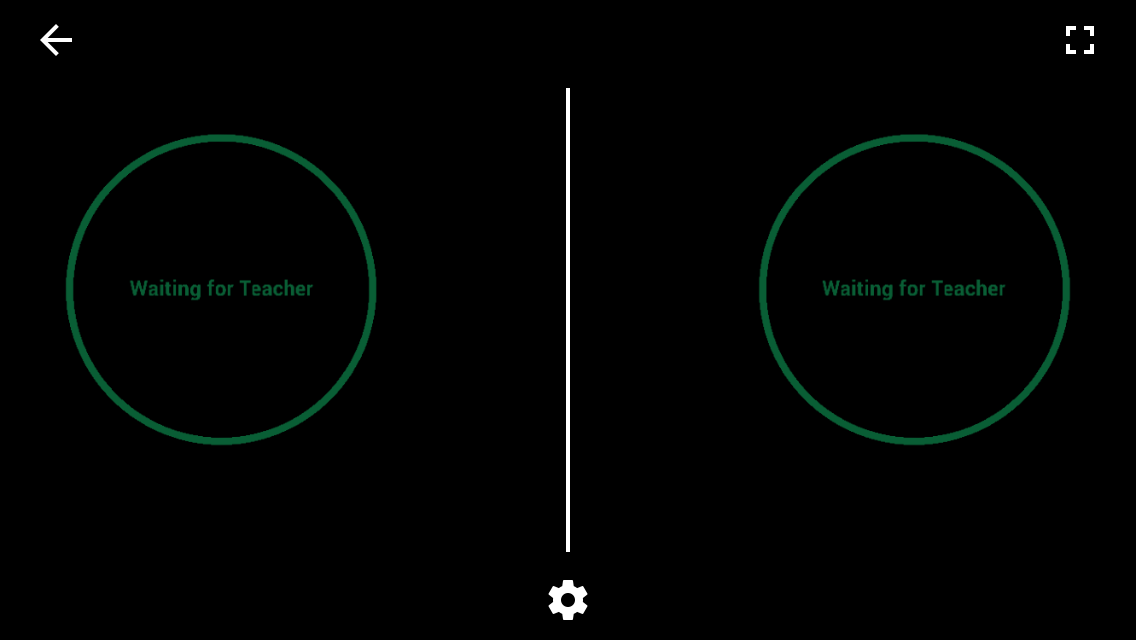
Student View - Waiting for Teacher to Press Play

Student View - Toggle Between VR Viewer and Full Screen


Student View - Full Screen

Teacher View - Swipe cards to the left for next scenes

Teacher View - Select Feature to View. Happy faces show where students are looking


Student View - Arrow shows where the teacher wants you to look


Student View - Target Feature

Student View - Cardboard Mode
While it would be pretty fun to have a class full of VR viewers, knowing that this is possible without is exciting! I have 7 ipads in our class and can probably borrow others from colleagues. We could set up a list of those on our site willing to share and schedule Expeditions to some of these amazing places!
Thank you, Jen, for sharing this amazing resource!

Saturday, April 4, 2015

Revisiting My Maps for More Learning


In February, I blogged about using MyMaps for showing data on a map. Click here for that post. We created a form to explore weather data and sent it out to friends and family. Amazingly enough, we received submissions from every continent! It was fun to look out, to read, and then to do some math subtraction practice on the temperatures recorded.

Recently, we revisited our map while working on learning measurement. We were able to use the math tools in Google Maps to measure distances from our home town and compare measurements between places listed. Students took it a step farther and found places they were interested in and explored how far those would be also.

We also mapped locations of colleges we were learning about and the distances to those.


This is so much more engaging than math problems in a textbook!

Tuesday, February 3, 2015

Weather Map Math


Using the info I learned from Molly Schroeder here, my second grade class set up a weather survey with Google Forms and My Maps. (See previous blog post). The survey quickly spread from friends and family of our class families and sharing on social media. Photos and weather data came flooding in. See our live map here.


We've been enjoying looking at the different locations and talking and writing about why temperatures and seasons would be different. I love that My Maps has an option to color code the pins based on whatever category we choose. I did manually change the warmest bands to orange and red and the very coldest to purple to help them stand out with the kids.

Today, we took another look at the maps during our math block. We are working on addition and subtraction of two and three digit numbers. I gave the kids this worksheet to guide them through comparing temperatures from our home location to a location of their choice.


It was great to see them talk it through in their groups, defend their answers, and explain why there would be a difference. Those who finished one location tried a second choice on a dry erase board. Students who I knew were ready for a challenge were encouraged to try a comparison with the negative temp in Fairbanks, Alaska and how might that work. Several of the kids shared and the class was able to give feedback.

Some images from the class:


We are so thankful for family and friends helping us with this project. We have map data from all over the US, and on all 7 continents - including Antarctica! I'm sure we will refer back to this map many times over the next few weeks. 

Thanks to Molly for her inspiration!

Thursday, January 1, 2015

Fun with My Maps


Recently I came across a link from Twitter to a you tube video from Teach Tech Play. They do a monthly teacher web share of lessons, tips, and ideas. This was December's episode and Molly Schroeder shared a great tip for using Google's My Maps with Google forms to share geographical data. You see Molly's part of the episode here. Teach Tech Play Episode 6.


Start at 30:15 to watch Molly's segment.
Basically, what you do is set up a Google form to collect data that includes location info. The collected info is gathered in a Google spreadsheet. Open My Maps (or just Google it). Follow Molly's instructions and demo on how to import the data.


Here is an example of my students sharing info from their winter break (names have been removed.) Example of Winter Break sharing map (<Link to live map example).

Example of My Maps


I also have plans use Molly's suggestion to collect weather and climate data from family and friends of the students to compare data from all over. I'm sure there are many many uses for this tool. Comment with your ideas, I'd love to hear them!

Thank you, Molly, for the great idea and explanation!
https://twitter.com/followmolly
https://sites.google.com/site/mydigitalfootprint/

Tuesday, November 4, 2014

What's with that clock change thing?


One of the best projects my classes have ever done has been participating in Mystery Class through Journey North. In this global game of hide and seek, the search is on to discover the location of 10 mystery class locations somewhere in the world. Hundreds of classrooms participate in this project ranging from second grade through 12th grade. 
We start prepping for this hunt the first week of school by noting the sunrise and sunset times in our city. How many hours of daylight do we have? Next week, will it be the same, or different? Why is it changing? Each week we look up this data, graph it, talk about it, wonder what it means. We discuss and think about time zones - why is it later when we call grandma on the East Coast? We trace our shadows at differnt times in the day, why are they longer shorter, going this way or that?
In January, we will start getting sunrise and sunset times for the 10 mystery locations. Based on what we've observed in our local area, we will make predictions about where these sites could be. Later we'll get some more data and geographical clues to research, narrow down, and hopefully confirm our guess. We will be right? Even I, the teacher, don't know. But finally the true locations will be revealed. Whether we are right or wrong doesn't matter as much as the quest and learning. But we are usually right ;)
Which brings me to my original question, what's with this time change thing? This week, while charting our daylight hours and the sunrise and sunset times, we noticed something strange. The pattern of change for the daylight stayed the same, we are losing about 13 or 14 minutes of daylight each week - this week about 10 hours and 46 minutes of daylight here. But the graph for the sunrise and sunset times took a big jump to the left. What happened there? Our entire class was able to connect that changing the clocks made our graph have a big change. It didn't change the amount of daylight, we didn't actually add or lose an hour, it just stepped to the left (or moved to the morning.) 
(I forgot to take a photo of our working graph. I'll do that tomorrow and add it here.)