Showing posts with label My Maps. Show all posts

Saturday, April 4, 2015

Revisiting My Maps for More Learning


In February, I blogged about using MyMaps for showing data on a map. Click here for that post. We created a form to explore weather data and sent it out to friends and family. Amazingly enough, we received submissions from every continent! It was fun to look out, to read, and then to do some math subtraction practice on the temperatures recorded.

Recently, we revisited our map while working on learning measurement. We were able to use the math tools in Google Maps to measure distances from our home town and compare measurements between places listed. Students took it a step farther and found places they were interested in and explored how far those would be also.

We also mapped locations of colleges we were learning about and the distances to those.


This is so much more engaging than math problems in a textbook!

Tuesday, February 3, 2015

Weather Map Math


Using the info I learned from Molly Schroeder here, my second grade class set up a weather survey with Google Forms and My Maps. (See previous blog post). The survey quickly spread from friends and family of our class families and sharing on social media. Photos and weather data came flooding in. See our live map here.


We've been enjoying looking at the different locations and talking and writing about why temperatures and seasons would be different. I love that My Maps has an option to color code the pins based on whatever category we choose. I did manually change the warmest bands to orange and red and the very coldest to purple to help them stand out with the kids.

Today, we took another look at the maps during our math block. We are working on addition and subtraction of two and three digit numbers. I gave the kids this worksheet to guide them through comparing temperatures from our home location to a location of their choice.


It was great to see them talk it through in their groups, defend their answers, and explain why there would be a difference. Those who finished one location tried a second choice on a dry erase board. Students who I knew were ready for a challenge were encouraged to try a comparison with the negative temp in Fairbanks, Alaska and how might that work. Several of the kids shared and the class was able to give feedback.

Some images from the class:


We are so thankful for family and friends helping us with this project. We have map data from all over the US, and on all 7 continents - including Antarctica! I'm sure we will refer back to this map many times over the next few weeks. 

Thanks to Molly for her inspiration!

Thursday, January 1, 2015

Fun with My Maps


Recently I came across a link from Twitter to a you tube video from Teach Tech Play. They do a monthly teacher web share of lessons, tips, and ideas. This was December's episode and Molly Schroeder shared a great tip for using Google's My Maps with Google forms to share geographical data. You see Molly's part of the episode here. Teach Tech Play Episode 6.


Start at 30:15 to watch Molly's segment.
Basically, what you do is set up a Google form to collect data that includes location info. The collected info is gathered in a Google spreadsheet. Open My Maps (or just Google it). Follow Molly's instructions and demo on how to import the data.


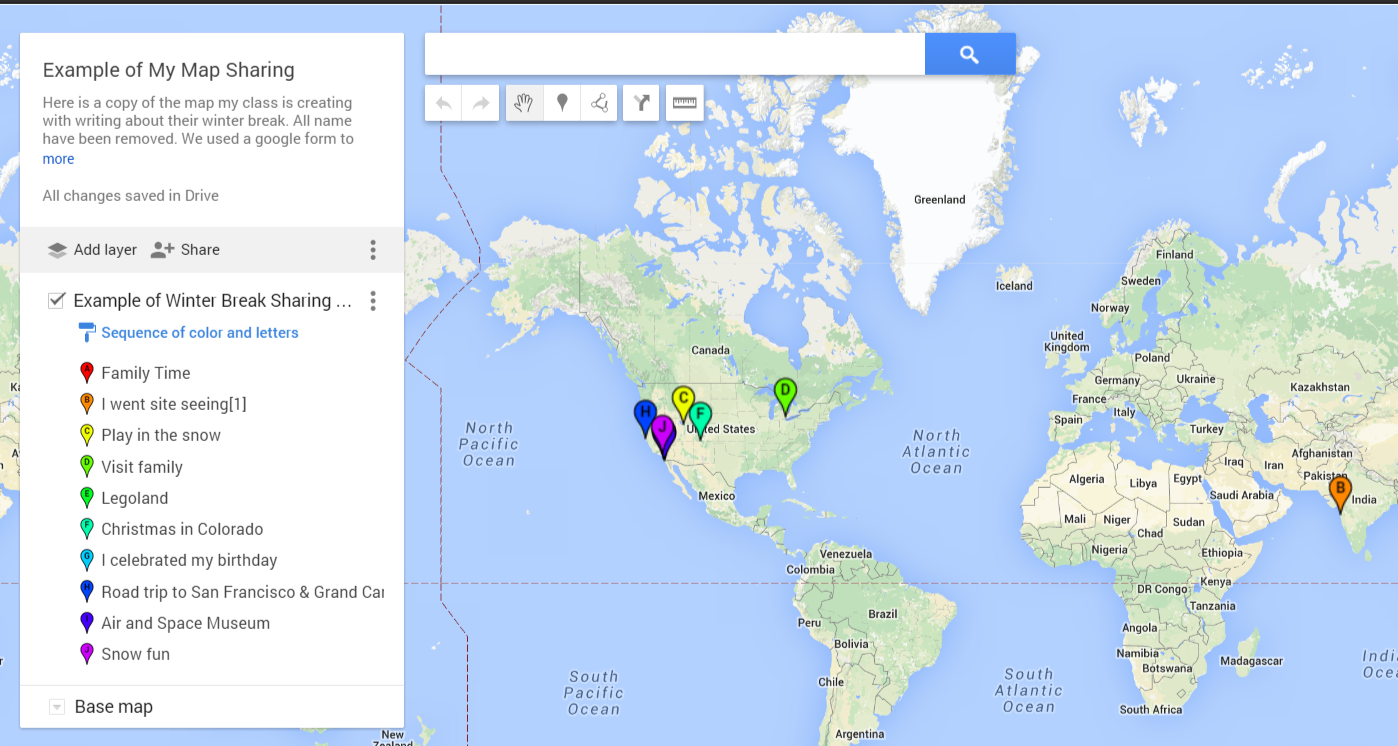
Here is an example of my students sharing info from their winter break (names have been removed.) Example of Winter Break sharing map (<Link to live map example).

Example of My Maps


I also have plans use Molly's suggestion to collect weather and climate data from family and friends of the students to compare data from all over. I'm sure there are many many uses for this tool. Comment with your ideas, I'd love to hear them!

Thank you, Molly, for the great idea and explanation!
https://twitter.com/followmolly
https://sites.google.com/site/mydigitalfootprint/